Fidelity's Timmer sees bitcoin double bottom pointing to $100,000
Fidelity's Jurrien Timmer says bitcoin is testing the $80,000 ceiling of a double bottom that targets $100,000, nine months after he called 2026 a year off.
Key points
- Timmer says a break above $80,000 would confirm a double bottom targeting $100,000.
- The pattern's troughs are $60,033 and $57,742, both below the $65,000 support he flagged in December.
- A textbook projection from the $57,742 low to the $80,554 line gives roughly $103,400.
- Kalshi traders price a 39% chance of bitcoin topping $100,000 in 2026, down from 41% a day earlier.
- US spot bitcoin ETFs took in $134 million on Sept. 25, a seventh straight day of inflows led by BlackRock's IBIT.
Fidelity's Jurrien Timmer says bitcoin is testing the $80,000 ceiling of a double bottom that points to $100,000, a reversal of the cautious stance he took nine months earlier. The director of global macro at Fidelity posted a weekly chart late on Friday with a one-line thesis, according to Bitcoin.com News. He wrote that bitcoin looks particularly interesting as it challenges key resistance at $80,000, and that a break would confirm a double bottom targeting $100,000.
Timmer went into 2026 warning that bitcoin may have ended another four-year cycle halving phase, in price and time. Days later he suggested 2026 could be bitcoin's year off, noting that crypto winters have historically lasted about a year. At that point he placed support for the asset in the $65,000 to $75,000 range.
The first half of that call held up, but the support band did not. Bitcoin fell to $60,000 in early February and to $57,800 in late June, well below the floor Timmer had flagged. Nine months on, his tone has flipped, with Timmer saying he senses a new four-year cycle bull market is underway.
Timmer reverses his stance
The chart behind the call uses data through Sept. 20 and labels two troughs at $60,033 and $57,742. A horizontal line runs across the $80,554 level, with the May high at $82,807 and the latest swing at $82,266 pressing against it. The all-time high of $126,251 sits at the top left of the chart.
The arithmetic supports the target, with room to spare. A double bottom's textbook target adds the depth of the pattern to the breakout level. From the $57,742 low to the $80,554 line is $22,812, which projects to roughly $103,400. Measured from the $82,807 May high instead, the target stretches to about $107,900, making Timmer's $100,000 the conservative version.
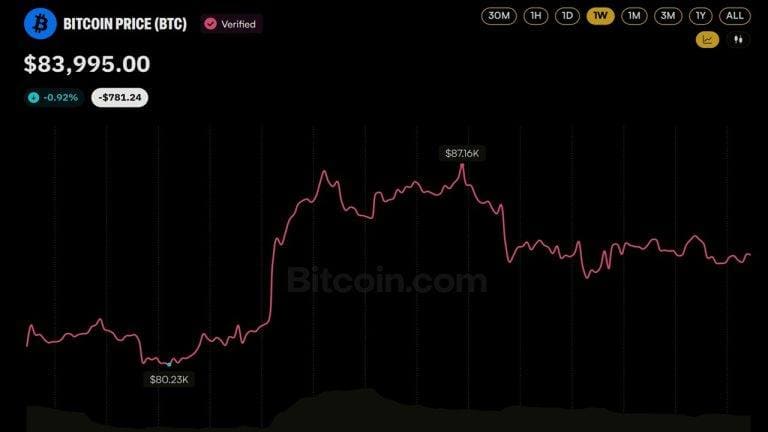
Bitcoin is already testing the line. It closed the week of Sept. 14 at $81,178 and was trading near $84,000 as of the article's publication. A weekly close there on Sunday would be the highest since the week of Jan. 19, when bitcoin finished at $86,670. Bitcoin.com News also reported this week that PlanB's October path to $100,000 depends on bitcoin holding above $80,500.
The double bottom maths
Prediction markets are less excited. Kalshi's 2026 bitcoin market prices a move above $100,000 this year at 39 cents, down from 41 cents a day earlier and below 46%. The $110,000 contract trades at 20 cents, while Kalshi's September contract on bitcoin topping $87,500 fell to 22 cents from 35 cents in 24 hours. Spot demand looks firmer: US spot bitcoin ETFs took in $134 million on Sept. 25, their seventh straight day of inflows, led by BlackRock's IBIT.