Bitcoin edges back toward $85,000 as technical signals stay positive
Bitcoin traded at $84,899 on Sunday morning, up 0.9% in 24 hours, with 14 moving averages positive but lighter volume leaving the recovery unproven.
Key points
- Bitcoin changed hands at $84,899 at 8 a.m. Eastern on Sept. 27, up 0.9% over 24 hours.
- The daily chart shows 14 positive moving averages, one neutral and no bearish readings.
- Bitcoin must clear $85,000 and $85,945 to challenge the Sept. 22 high of $87,374.
- Support sits at $83,300, with $80,106 and the mid-September low of $74,913 below that.
- Momentum at 8,491 and MACD at 2,473 are the two bullish oscillator readings.
Bitcoin was trading at $84,899 on Sunday, Sept. 27 at 8 a.m. Eastern time, up 0.9% over 24 hours, as buyers pushed the price back toward $85,000 after a retreat from $87,374, Bitcoin.com News reports. The daily technical picture remains positive, with 14 moving averages giving favourable readings, though lighter trading volume suggests the recovery still has something to prove.
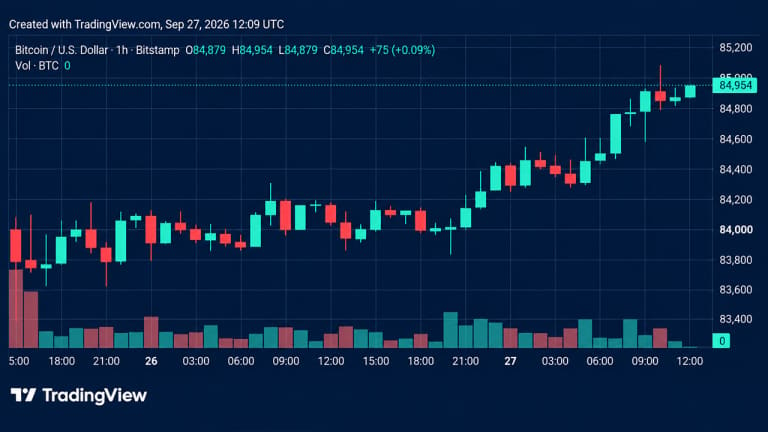
The one-hour chart shows bitcoin steadily clawing back ground after its Sept. 23 drop into the low $83,000s. Between Sept. 24 and Sept. 25 the price traded between roughly $83,300 and $85,300, and it has since worked toward $84,870, putting the $85,000 threshold in focus. The advance has come on considerably lighter volume than the Sept. 21 to Sept. 23 activity.
A sustained move above $85,000 would bring $85,300 and then $87,374 back into view, while rejection at that barrier could keep bitcoin inside its recent range. Losing $84,000 and then $83,300 would put the two-day recovery under pressure, according to the report.
Bitcoin nears $85,000 again
The four-hour chart tells a similar story and shows how wide the range has been since the mid-September low of $74,913. After the sharp advance to $87,374 between Sept. 18 and Sept. 22, bitcoin fell back into the $83,000 to $84,000 area before recovering toward $85,000. Immediate resistance is within striking distance, with $86,500 and $87,374 as further upside reference points, while the $83,000 to $84,000 shelf is an important defensive position.
On the daily chart, bitcoin continues to reflect a substantial recovery from its June low of $57,735, with July and August building a base before September's advance to $87,374. The latest candles hold in the mid $84,000s, above the summer trading range, although daily volume has cooled. A daily close above $87,374 would set a fresh high for the visible September structure, while losing the mid $84,000s could expose the $74,900 to $80,000 zone.
Oscillator readings show nine neutral signals, two positive and none negative. The relative strength index is 66, Stochastic 77, the commodity channel index 91 and the average directional index 44, all neutral. Momentum at 8,491 and the moving average convergence divergence level at 2,473 are the bullish readings.
Resistance and support levels
The 24-hour moving averages give 14 positive readings, one neutral and none bearish. Bitcoin trades above every listed exponential and simple moving average, including the 10-period EMA at $83,328 and the 20-period EMA at $81,433, with the 200-period EMA and SMA at $74,142 and $71,076. Only the Ichimoku baseline at $81,144 is neutral, leaving the configuration firmly positive.